What Is ROI? Hidden Value & Real Business Examples

Published Date
What Is ROI and How to Calculate It
Most people think of ROI—Return on Investment—as a simple equation: what you put in versus what you get out. It’s often treated as a percentage that shows whether something was “worth it.”
And sometimes, it really is that simple.
But when you start looking at ROI through a business lens, it helps to separate what shows up clearly in the financials from what doesn’t. Some returns are easy to track in the income statement or balance sheet. Other returns come from better decisions—by managers, sales teams, or plant leaders—that create measurable business impact even if they don’t show up right away.
Sometimes It's Simple to Measure ROI
At its core, ROI compares the benefit gained from an initiative to the cost of making it happen.
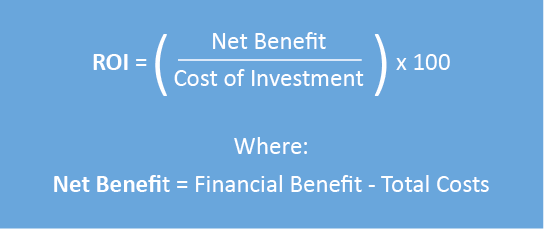
If you spend $50,000 on new software and save $75,000 in costs, your ROI is:
($75,000 - $50,000) ÷ $50,000 = 50%
That’s a clear, direct return for your investment.
But many real-world business decisions don’t produce neatly labeled gains—and that’s where things get interesting.
(Want to run your own numbers? Our ROI Calculator walks you through a 3-year projection—so you can compare short-term cost to longer-term value. It’s a simple tool, but it’s often enough to turn a vague hunch into a real business case.)
Easy-to-See ROI: Simple Examples That Show Up in the Financials
Some returns are visible right away—and easy to tie directly to a decision. Here are three quick examples:
Example 1: Increased sales revenue:
A targeted marketing campaign costs $10,000 and generates $100,000 in new sales. With a 40% gross margin, that’s $40,000 impact to the gross profit line.
ROI = (40,000 – 10,000) / 10,000 = 300%
Example 2: Reduced costs:
A company upgrades to energy-efficient lighting for $25,000 and cuts annual utility bills by $15,000.
ROI = (15,000 – 25,000) / 25,000 = -40% in year one, in year one, which isn’t promising. But extend the timeframe to 3 years… the benefit is 45,000 so ROI = (45,000 – 25,000) / 25,000 = 80%
Example 3: Freed-up working capital:
A team spends $1,200 to improve inventory management and reduces average stock levels by $200,000. That freed-up capital is reinvested or used to pay down debt. If it pays down debt and the interest rate is 5% interest rate, that’s $10,000 in annual savings.
ROI = (10,000 – 1,200) / 1,200 = 735%
These benefits will show up in the income statement or balance sheet — they’re the easiest ROI to track, and they demonstrate a clear business impact.
Some Returns Are Harder to See
Some returns are easy to measure and show up clearly in financial statements. Others create real business value but don’t connect cleanly to a specific decision—or don’t leave a direct financial trace.
For example:
- A process improvement might reduce errors, but the cost savings get absorbed into overall labor or operations.
- Better documentation might reduce risk or delays, but those gains don’t appear as a line item.
- Stronger internal alignment might accelerate project delivery, but the time saved doesn’t convert neatly into dollars.
These are real returns. But because they’re indirect, they fall into the category of hidden ROI—the kind of value you see over time, across teams, and often in the absence of problems. This hidden ROI is just as critical to measurable results as the direct numbers, because it demonstrates business impact that compounds over time.
A Practical Example: Time Savings
Imagine your company introduces a process improvement that reduces average meeting time by 15 minutes. Employees attend 10 meetings per week, so that’s 150 minutes saved per person weekly.
With 100 employees, that’s 15,000 minutes—or 250 hours—of time saved each week. At an average hourly wage of $50, that’s $12,500 per week in time value, or $650,000 per year.
If the cost of implementing the improvement was $100,000:
ROI = (650,000 – 100,000) / 100,000 = 550%
But here’s the real gain: that time doesn’t just vanish—it becomes available for something else. More focus. Faster execution. Less burnout. Better decisions. These things don’t show up on a financial statement, but they ripple through the business.
This ROI is “hidden.” It doesn’t show up as a line item—but it affects everything from bandwidth to momentum.
Hidden ROI: What Comes Next
Once you recognize that some returns don’t show up as neat dollar amounts, it’s easier to start spotting them. Some of the most important business returns fall into this “hidden” category. A few examples:
- Time saved by streamlining a workflow
- Morale gains from recognizing team contributions
- Reduced risk from better documentation or compliance
- Faster decisions due to improved data access
None of these can be tracked on line items of the Income Statement or Balance Sheet. Some of them DO have a dollar value (time saved); some of them do not (morale gain). Reduced risk might have a dollar amount if there is a reduction in fines paid.
Faster decisions might have a dollar amount if there is an opportunity identified.
But each one can strengthen financial performance over time.
What About the Denominator?
We’ve looked at how it’s sometimes difficult to calculate the benefit or gain. But what happens when you can’t clearly calculate the cost either?
Just as often, the challenge is in calculating the investment side—the denominator.
What did it actually cost?
- Was it time from a cross-functional team?
- Was it internal headcount, outside consulting, or software?
- Were there opportunity costs?
When the denominator is fuzzy, the ROI number becomes just as unreliable as when the numerator is vague. A good estimate is still helpful—but it’s critical to be transparent about what went into the investment.
In some cases, the cost of an initiative is intentionally hard to separate. For example, a major strategic shift might involve dozens of smaller efforts across multiple quarters. In those cases, story-based ROI (narrative + metrics) can be more credible than a questionable percentage.
When ROI Becomes a Matter of Science vs. Politics
Sometimes, the math is accurate—but still hard to believe. Imagine you spend just $1 and generate $3,001 in benefit. That’s a 300,000% ROI. It is mathematically correct—but will it be taken seriously?
That’s where credibility—and politics—come into play. An ROI figure that seems too good to be true can trigger skepticism, scrutiny, or pushback from decision-makers. Internal politics may question the validity of the result, even if the math checks out.
Adding reasonable assumptions—like $50 of your time—raises the cost to $51 and drops the ROI to 5,786%. Still impressive. But now it feels more grounded and credible in a business setting.
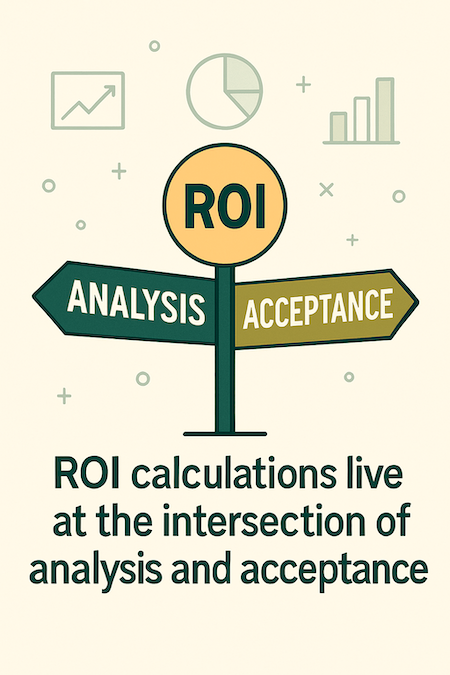
ROI calculations live at the intersection of analysis and acceptance. They require not just mathematical rigor but also narrative credibility. Context, realism, and political savviness matter as much as precision.
What's the Why?
Understanding ROI—both direct and hidden—isn’t just a finance skill. It’s a business thinking skill. And the more clearly you see where value is created, the more effective your decisions become.
]
Sometimes the win is measurable in dollars. Sometimes it’s seen in momentum, time, trust, or alignment. The key is knowing where to look—and how to tell the story of impact.
Try This: Apply the ROI Lens to One Decision
Think about a recent initiative, project, or change you supported. Ask:
- What did it cost (time, money, attention)?
- What changed as a result?
- Did that change show up financially—or did it create longer-term value?
Then try running the numbers—or sketching the story. Either way, you’re building your business acumen.
Use the 3-Year ROI Calculator — a free tool from Income|Outcome
The ROI Challenge™
The ROI Challenge™ Playbook is part of our Continue the Learning (CTL) series.
It challenges participants to develop a small initiative, pressure-test the business logic, and—if it holds up—run with it and track the results. It builds the habit of tying actions to outcomes and making the case for impact.
It’s not a recap of the simulation learning—it’s a call to action to put that learning into practice.
Already completed an Income|Outcome workshop?
Check your Continue the Learning email for access to the Playbook.
For L&D Leaders:
This is one way we help participants keep thinking—and applying—long after the workshop ends.
👉 Want to talk about how ROI shows up in your learning programs? Get in touch and we’ll walk you through real examples.