Understanding the Cash Conversion Cycle


Eliza Helweg-Larsen
Published Date
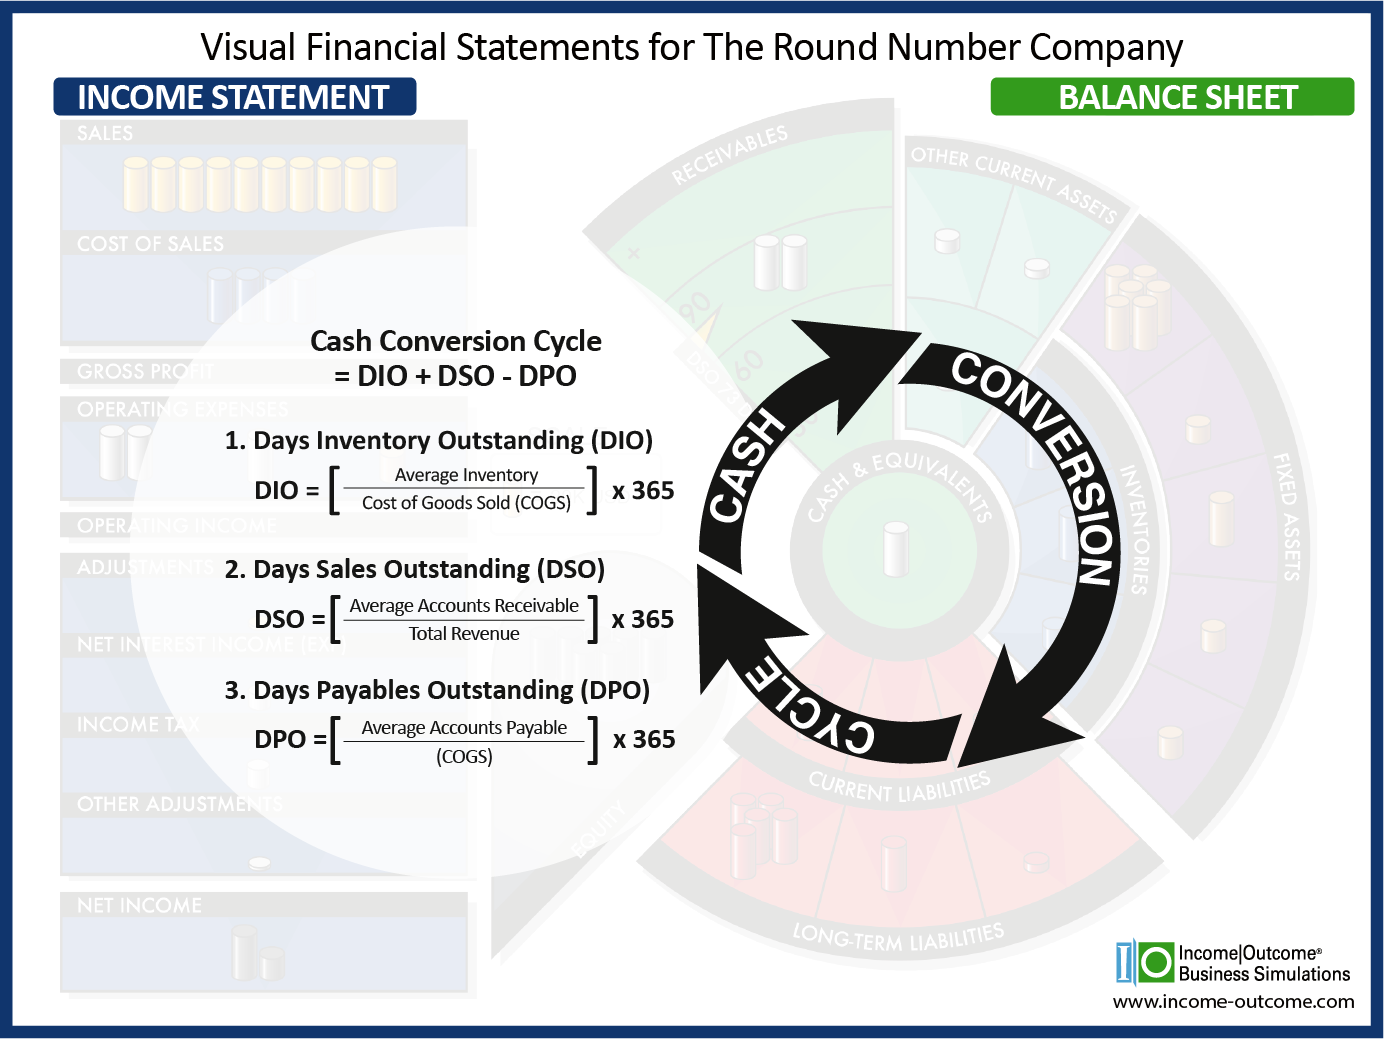
In the world of business finance, managing cash flow effectively can mean the difference between thriving and merely surviving. One critical metric that businesses often use to gauge their efficiency in this area is the Cash Conversion Cycle (CCC). This metric looks at the short-term cash flows into and out of the company. It takes into account how much time the company needs to sell its Inventory, how much time it takes to collect Receivables, and how much time it has to pay its bills (Payables). A lower number is preferred.
In this article, we’ll break down the CCC into its three main components: Days Inventory Outstanding (DIO), Days Sales Outstanding (DSO), and Days Payable Outstanding (DPO). We’ll also explore practical examples and provide illustrations to make these concepts clear.
See the Note at the bottom of this post regarding data used in the calculation of CCC.
What is the Cash Conversion Cycle (CCC)?
The Cash Conversion Cycle (CCC) measures the time it takes for a company to convert its resource investments into cash. Essentially, it’s the period between when a company pays for its inventory and when it receives cash from selling that inventory. The shorter the cycle, the less time capital is tied up in the business process, and the quicker a company can reinvest its cash into growth opportunities.
The CCC allows businesses to evaluate how efficiently they are managing their resources and cash flows. A shorter CCC is often indicative of a well-managed company, while a longer CCC might suggest inefficiencies that need addressing.
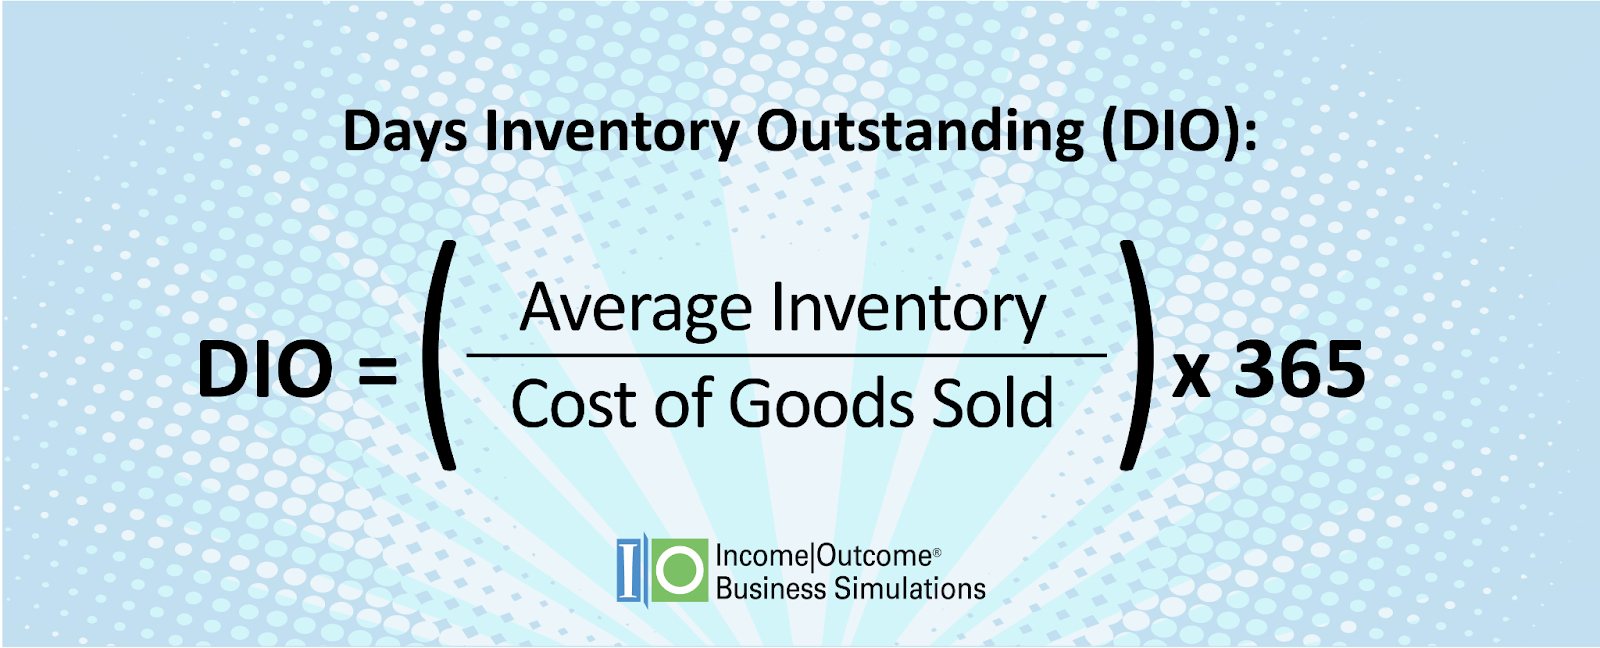
Days Inventory Outstanding (DIO)
Definition:
Days Inventory Outstanding (DIO) is the average number of days a company takes to sell its entire inventory. It’s a crucial part of the CCC as it indicates how efficiently inventory is being managed.
A manufacturing company produces consumer electronics. If their DIO is 45 days, it means that, on average, it takes 45 days from the time they purchase raw materials until they sell the finished product. Lowering this number would mean faster turnover and better cash flow.
- Target: Average Inventory = (11,886 +13,499)/2 =12,693
- DIO = (12,693/77,736)*365 = 59.6 days
- Walmart: Average Inventory = (54,892 + 56,576)/2 = 55,734
- DIO = (55,734/490,142)*365 = 41.5 days
- Amazon: Average Inventory = (33,318+ 33,318)/2 = 33,862
- DIO = (33,862/304739)*365 = 40.6 days
So Walmart and Amazon both move inventory more quickly than Target. This can be a factor of inventory types (groceries vs clothing vs furniture etc), centralized warehouses, store locations, etc.
Looking at Grocery Sales as a Percentage of Total Sales:
- Walmart: Grocery sales account for approximately 58.8% of Walmart’s total sales in the U.S. (1)
- Target: Grocery sales represent about 20% of Target’s total sales, focusing more on general merchandise and apparel compared to Walmart's strong grocery emphasis. (2)
One of the reasons Walmart has a shorter DIO than Target may be that groceries must turn over faster than other product lines!
(2) Statista
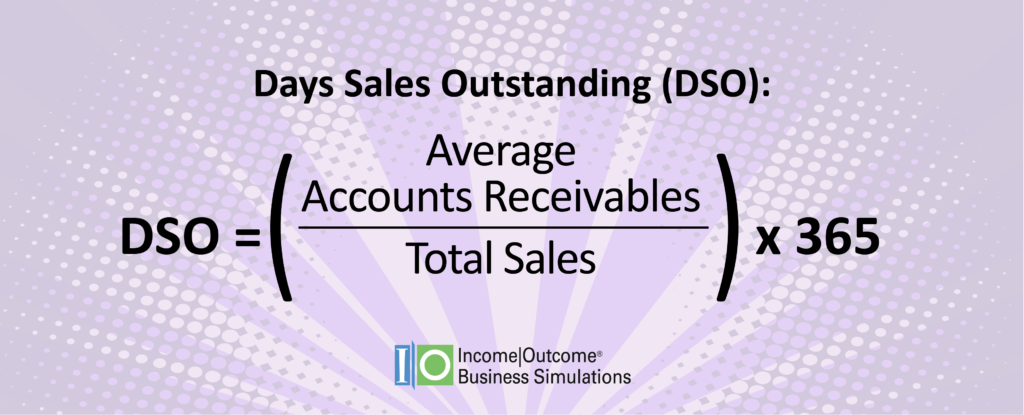
Days Sales Outstanding (DSO)
Days Sales Outstanding (DSO) measures the average number of days it takes a company to collect payment after making a sale. It reflects how quickly a company can convert its accounts receivable into cash.
If a company has DSO of 30 days, it means they take, on average, 30 days to receive payment from their customers. If they can negotiate with customers for shorter payment period, they will get the cash sooner.
Example: Many retail firms do not extend credit directly to their customers–they accept payment in cash and credit cards. The credit card company typically pays the retailer within 2-3 days so the DSO will very low.
- Target: Average Receivables = (1,404 +1,695)/2 =1,550
- DSO = (1,550/105,803)*365 = 5.3 days
- Walmart: Average Receivables = (8,796 + 7,933)/2 = 8,365
- DSO = (8,365/648,125)*365 = 4.7 days
- Amazon: Average Receivables = (51,750 + 41,995)/2 = 46,873
- DSO = (46,873/574,785)*365 = 29.8 days
Target and Walmart both offer their own credit cards, but even so, their DSO ratios are quite low. Amazon also has a credit card, but they offer ‘pay later’ plans, so this will increase their DSO ratio.
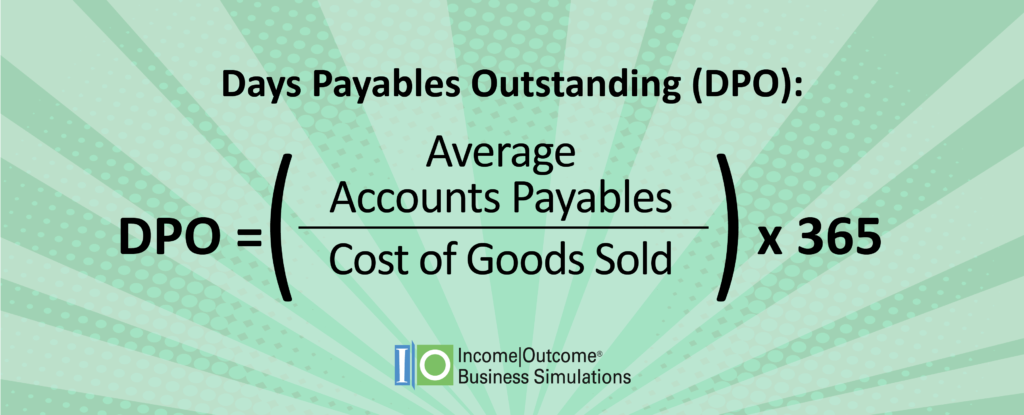
Days Payable Outstanding (DPO)
Definition:
Days Payable Outstanding (DPO) is the average number of days a company takes to pay its invoices. This metric provides insight into how well a company is managing its outgoing payments.
If a company has DPO of 60 days, it means they take, on average, 60 days to pay their suppliers. If they can negotiate with the supplier to extend this period, it allows the company to hold onto its cash longer.
Example: Large retail firms are usually able to negotiate longer payment terms because they are purchasing large volumes of inventory.
- Target: Average Payables = (10,498+11,887)/2 =11,193
- DPO = (11,193/77,736)*365 = 52.6 days
- Walmart: Average Payables = (56,812 + 53,742)/2 = 55,277
- DPO = (55,277/490,142)*365 = 41.2 days
Amazon has a very high DPO ratio:
- Amazon : Average Payables = (84,981 + 79,600)/2 = 82,291
- DPO = (82,291/304,739)*365 = 99 days
The third party reseller relationships drive Amazon's DPO of 168 days–it is dramatically higher due to its marketplace model and their process for paying suppliers.
Cash Conversion Cycle
The Cash Conversion Cycle (CCC) involves looking at all three key components: Days Inventory Outstanding (DIO), Days Sales Outstanding (DSO), and Days Payable Outstanding (DPO). Together, these metrics illustrate how quickly a company manages inventory, collects receivables, and pays suppliers.
Example: Cash Conversion Cycle = DIO + DSO - DPO
- Target: DIO = 59.6 days, DSO = 5.3 days, DPO = 52.6 days
- Cash Conversion Cycle for Target: 59.6. + 5.3 - 52.6 = 12 days
- Walmart: DIO = 41.5 days, DSO = 4.7 days, DPO = 41.2 days
- Cash Conversion Cycle for Walmart: 41.5 + 4.7 - 41.2 = 5 days
- Amazon: DIO = 40.6 days, DSO = 29.8 days, DPO = 98.6 days
- Cash Conversion Cycle for Walmart: 40.6 + 29.8 - 29.8 = -28 days
All three retailers have similar Cash Conversion cycles, indicating good cash flow. This is a competitive advantage, especially in the retail industry!
How to Optimize the Cash Conversion Cycle
Strategies for Improvement:
- Inventory Management: Implement just-in-time (JIT) inventory systems to reduce DIO.
- Payment Terms: Negotiate better payment terms with customers and suppliers to optimize DSO and DPO.
- Technology: Use automated systems to streamline accounts receivable and payable processes.
It's a Balancing Act:
Optimizing the CCC is about finding the right balance between DIO, DSO, and DPO. A company that manages these three elements effectively can reduce its cash flow cycle and ensure that it has enough liquidity to invest in growth opportunities.
Conclusion
The Cash Conversion Cycle is a powerful tool for understanding and optimizing a company’s cash flow. By analyzing and adjusting DIO, DSO, and DPO, businesses can improve their operational efficiency and strengthen their financial position. Whether you're leading a team, financial selling, or making decisions that impact financial outcomes, understanding your CCC can help you make smarter, more informed choices that drive long-term success."
A Tale of Cash Conversion Cycle
In the 1990s, Dell Inc. revolutionized its operations by adopting a build-to-order model, transforming its cash flow dynamics. By manufacturing products only after receiving customer orders, Dell kept its inventory levels exceptionally low, minimizing its Days Inventory Outstanding (DIO) and achieving a highly efficient cash conversion cycle (CCC).

Even more remarkable was Dell's ability to achieve a negative CCC. By selling directly to customers and receiving payments before products were even built, the company had cash in hand long before paying suppliers. This strategy significantly boosted liquidity, allowing Dell to reinvest in the business and maintain a competitive edge.
This innovative approach helped fuel Dell’s rapid growth and success during the 1990s and early 2000s. However, by 2008, Dell began shifting away from its build-to-order model to focus on cost reduction and supply chain efficiency, marking a new chapter in its business strategy.
- Average Inventory = (3,622 + 4,776)/2 = 4,199
- DIO = (4,199/67,556)*365 = 22.7 days
- Average Receivables = (9,343 + 12,860)/2 = 11,102
- DSO = (11,102/88,425)*365 = 45.8 days
- Average Payables = (19,389 + 20,665)/2 = 20,027
- DPO = (20,027/67,556)*365 = -108.2 days
Cash Conversion Cycle = 22.7 + 45.8 - 108.2 = -39.7 Days
Even today, Dell continues to manage its cash flow!
===========================
Note about Averages and Data Average
If you notice there are discrepancies in published results for Cash Conversion Cycle or DPO for a company, it may be that ‘average’ is being calculated differently.
There are several ways of calculating the ‘average inventory’ (or receivables or payables).
- The simplest approach is to use the year end (this gives a ‘rough approximation’)
- Another method is to average the beginning of the year and end of year. This method is used in this blog post.
- The most precise approach is to average the data for the beginning of year, Q1, Q2, Q3, and end of year.
As long as you use the same approach your trend analysis should be consistent across different years and/or companies.
Note about Payables vs Payables & Accrued
The Visual Finance reporting combines ‘Payables and Accrued’ as a single data point. In this case, the data cannot be used to calculate Days Payable Outstanding since it will give a misleading value. You will have to go to another data source to gather the Payables information.